Here’s a clear overview of **Code Profiler Pro 1.7.7 – WordPress Performance Profiling and Debugging**:
—
## 🧠 What It Is
**Code Profiler Pro 1.7.7** is a **performance profiling and debugging plugin for WordPress** that helps developers, site owners, and performance specialists **identify slow code and bottlenecks at the PHP level**. It works by analyzing how much **execution time, memory, database queries, and file operations** are consumed by themes, plugins, and custom code — letting you find and fix performance issues efficiently. ([WordPress.org][1])
Version **1.7.7** was released on **June 23, 2025** and focused on **bug fixes related to HTTPS detection and WP-CLI compatibility**. ([WordPress.org][1])
—
## ⚙️ What It Does
**Code Profiler Pro** takes the concept of a *code profiler* (a tool used in software development to measure where a program spends its time) and brings it into the WordPress admin dashboard. It’s especially useful for debugging slow performance in complex WordPress environments. ([WordPress.org][1])
### 🛠 Core Profiling Capabilities
* **Plugin & theme performance profiling** to see which components slow down your site. ([WordPress.org][1])
* **Scripts performance profiling** to analyze individual scripts (Pro feature). ([WordPress.org][1])
* **Methods & functions profiling** to pinpoint slow PHP functions (Pro feature). ([WordPress.org][1])
* **Database query analysis** to surface slow or excessive queries (Pro feature). ([WordPress.org][1])
* **File I/O and disk usage monitoring** to track slow or unnecessary file operations. ([WordPress.org][1])
* **Frontend and backend profiling** so you can check both public pages and admin workflows. ([WordPress.org][1])
### 📊 Reporting & Utilities
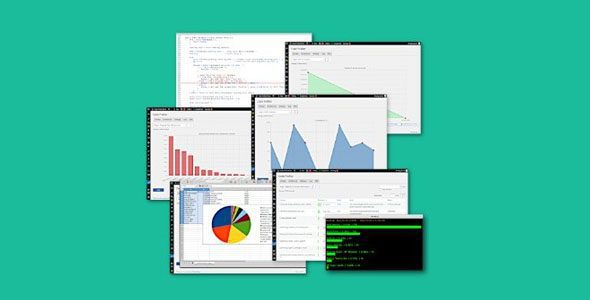
* **Charts and visual tables** that show performance metrics (exportable as PNG). ([WordPress.org][1])
* **WP-CLI integration** for command-line profiling. ([WordPress.org][1])
* **Support for profiling GET/POST requests**, cookies, and HTTP headers to test complex flows like forms or checkout pages. ([WordPress.org][1])
* **Exportable CSV/structured data** and filtering options (Pro features) for in-depth reporting. ([WordPress.org][1])
—
## 🎯 Why It’s Useful
This kind of plugin is helpful when you need to:
✔ **Diagnose performance bottlenecks** — see exactly which theme or plugin component is slowing down your site. ([Themespanda | A Free Resources Platform][2])
✔ **Compare alternatives** — bench test multiple plugins serving similar purposes to pick the best performer. ([Themespanda | A Free Resources Platform][2])
✔ **Optimize hosting setups** by understanding what stresses your server most. ([Themespanda | A Free Resources Platform][2])
✔ **Support debugging during development** — identify slow functions and queries as you build features. ([WordPress.org][1])
Users report that the plugin can help reveal performance-heavy plugins or code parts that would otherwise be hard to find without in-depth profiling tools. ([WordPress.org][1])
—
## 🧪 How It Works
Once installed and activated in WordPress:
1. **Select where to profile** — frontend, backend, specific URLs, cron events, or custom form submissions. ([WordPress.org][1])
2. **Run the profiler** — a detailed scan runs, measuring time, memory, database, and I/O usage. ([WordPress.org][1])
3. **Inspect results** — results are shown as charts/tables in the admin dashboard. ([WordPress.org][1])
4. **Use insights to optimize** — disable, replace, or optimize slow plugins, themes, or functions based on the results. ([Themespanda | A Free Resources Platform][2])
—
## ⚠️ Notes
* The **free version of Code Profiler** is available on WordPress.org and provides basic profiling, but the **Pro version adds deeper insights like functions, database queries, and export features**. ([WordPress.org][1])
* For deep performance debugging, using Code Profiler in combination with caching and other WordPress optimization strategies yields the best results. ([Themespanda | A Free Resources Platform][2])
—
## 🧠 Summary
**Code Profiler Pro 1.7.7** is a WordPress plugin that brings **software-level performance profiling and debugging tools into the WordPress admin** — helping you identify slow plugins, themes, functions, and database queries with detailed reports and visual charts. It’s a powerful tool for developers and site administrators who want to **diagnose performance issues, optimize code, and speed up WordPress sites**. ([WordPress.org][1])
—
If you want, I can also explain **how to profile your WordPress site step by step** using this plugin and interpret the results!
[1]: https://wordpress.org/plugins/code-profiler/?utm_source=chatgpt.com “Code Profiler – WordPress Performance Profiling and Debugging Made Easy – WordPress plugin | WordPress.org”
[2]: https://themespanda.com/wordpress/code-profiler-pro-1-7-7-wordpress-performance-profiling-and-debugging/?utm_source=chatgpt.com “Code Profiler Pro 1.7.7 – WordPress Performance Profiling and Debugging | Themespanda”
